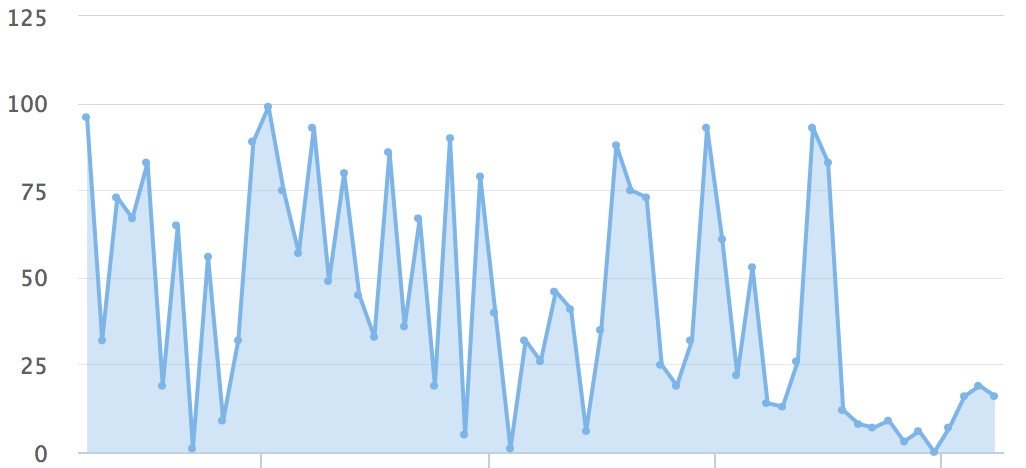
TL;DR — I started writing this article a long time ago while I was working for @mickael at ProcessOne. I never finished this article and a few things changed since but it might still help you to do realtime analytics for your service.
Just looking for the code? Check this github repository.
When I need to show realtime analytics to users I use:
- Batsd for storing datapoints.1
- Highcharts to display the datapoints.
- Server Side Events for the realtime part in the browser.
I patched batsd to send a PUBLISH Redis command everytime it stores a new entry. You can easily subscribe to this to deliver realtime datapoints back to the browser.
Batsd doesn’t seem to be moving that much the past year, and I would suggest looking for an alternative or just using the original statsd.
Highcharts is nice, but these days everyone
wants realtime and the charts alone isn’t enough. We already use
batsd (a
statsd replacement by
37signals, using Ruby) to store all analytics. It
includes a server you can poll to retrieve data, and I patched
it to send a publish call through redis and its pubsub feature to get those
values realtime, it allows the SSE part of the application to get data
automatically through em-hiredis.
Part 1
This part doesn’t cover everything, we’ll just go through the setup of highcharts, and pushing random data through SSE. You can see the code on the github blog-sse repository, and if you look at each commits from the initial one you can pretty much see each diff adding features.
We use a complete async stack through sinatra-sse and you therefor need to
use thin for the development server, and rainbows for the production part.
So the Gemfile includes:
gem 'sinatra'
gem 'sinatra-sse'
gem 'thin'
Commits
The following commits will help you setting things up:
- commit showing you how to set highcharts, displaying random values from within Javascript itself (no SSE).
- commit
showing you how to connects to SSE, exposing a
sinatraserver through themountroutes method.
Highcharts configuration
What took me a while to figure out, you need to
prefill
points to highcharts, as it will only keep a fixed amount of points (you can
change that in the settings but it doesn’t look so good) and then you call the
SSE
with new EventSource, and use this
callback
to add points to the existing highcharts graph.
SSE Rails configuration
I use sinatra-sse which takes care sending an empty line to the browser every
28
seconds
to keep connected, it’s a small gem. You can then use it to push new
data
to the client.
Nginx
If you don’t see values coming from SSE, you might be using a nginx proxy.
Nginx buffers the data from thin, and won’t send anything to the browser before
about 20 or 30 seconds, to fix this you must add proxy_buffering off; to your
server:
server {
 root /home/penso/push_console/public/;
 index index.html index.htm;
 server_name localhost;

 location / {
  proxy_set_header  X-Real-IP  $remote_addr;
  proxy_set_header  X-Forwarded-For $proxy_add_x_forwarded_for;
  proxy_set_header Host $http_host;
  proxy_redirect off;
  proxy_max_temp_file_size 0;
  proxy_buffering off; # <----------- here

  if (-f $request_filename) {
   break;
  }

  if (-f $request_filename/index.html) {
   rewrite (.*) $1/index.html break;
  }
  if (-f $request_filename.html) {
   rewrite (.*) $1.html break;
  }

  if (!-f $request_filename) {
   proxy_pass http://localhost:3000; # <--- redirection to thin
   break;
  }
 }
}
Part 2
The idea is to use em-hiredis do fetch data from redis. Write a sinatra app
looking like:
require 'em-hiredis'
class AnalyticsSSE < Sinatra::Base
  get '/' do
    sse_stream do |out|
      ActiveRecord::Base.connection_pool.with_connection do
        bucket_name = params[:id]
        redis.pubsub.subscribe(bucket_name) do |msg|
          unless msg.blank?
            out.push event: bucker_name, data: msg.to_json
          end
        end
      end
    end
  end
end

# and add it to your routes like:
MyApp::Application.routes.draw do
  mount AnalyticsSSE: '/realtime-analytics'
end
Calling your URL as you can see in my code allows you to receive real-time datapoints, you can finally add them to you graphs.
You can reach me at @fabienpenso.
-
Batsd doesn’t get love anymore, I recommend going to statsd instead. ↩
